
XLA vs SLA: experience-oriented metrics that are transforming IT support
Today, the service desk must go beyond simple operational KPIs and adopt metrics capable of measuring the real experience users have with IT services.
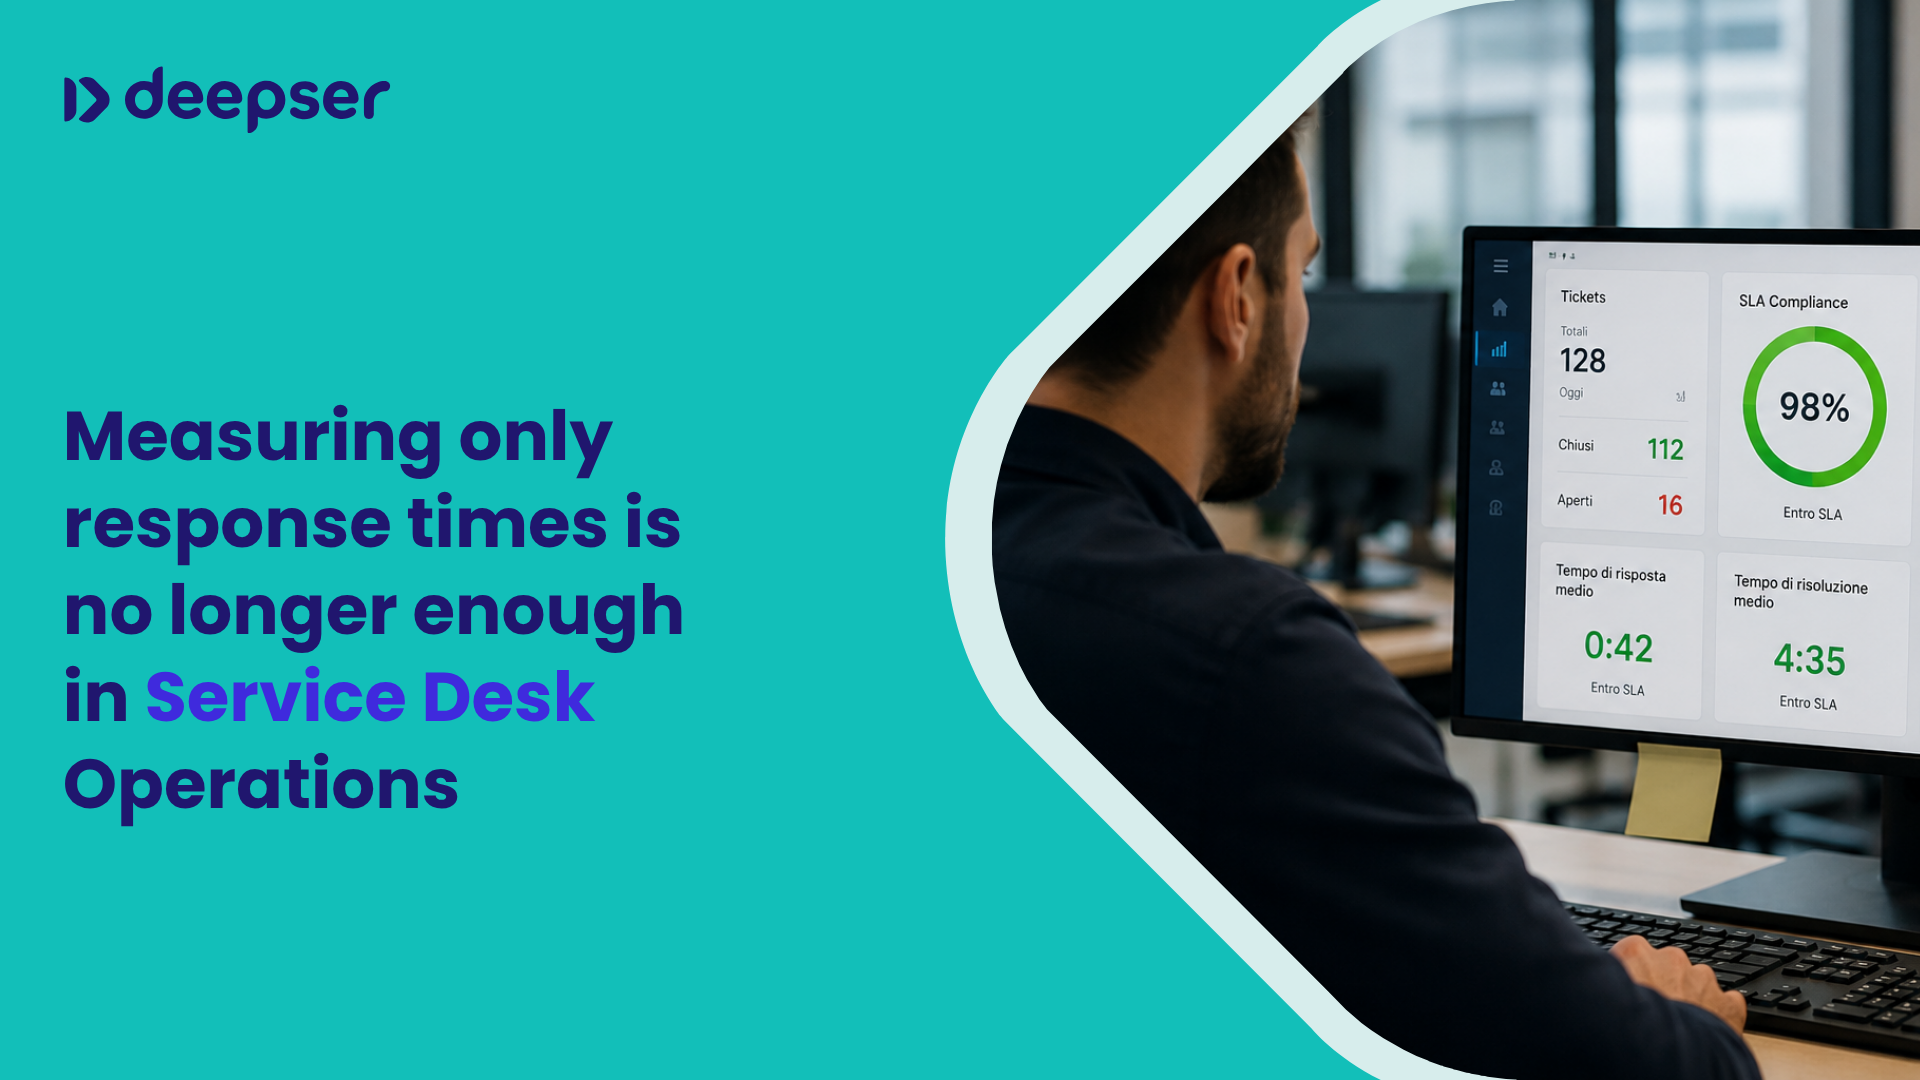
Imagine a situation that is common in many companies. An important meeting is about to begin, a presentation still needs final adjustments, and everything depends on a laptop that suddenly stops working. There are only two hours left before the meeting. The employee opens a ticket, the service desk responds within 15 minutes, starts troubleshooting, and eventually orders a replacement device that will arrive the following day. Ticket closed, SLA met, dashboard green. From the IT department’s perspective, everything worked perfectly: response times were respected, the process was followed correctly, and the ticket was handled according to the expected standards. Meanwhile, however, that employee missed the meeting, had to rebuild part of the work on a temporary device, and spent half a day unable to work effectively. If you asked how the experience went, the answer would be anything but “green.”
Without even realizing it, many people have already experienced a scenario like this firsthand: the so-called “Watermelon Effect” — green on the outside, red on the inside. Operational KPIs look excellent, but beneath the surface users are frustrated. SLAs were created when IT success was measured through availability and resolution times. Today, with hybrid work and technology at the center of every business activity, knowing that 95% of tickets were closed within 24 hours says nothing about what truly matters: was the employee able to get back to work? Did they feel supported?
To close this gap, Experience Level Agreements (XLAs) are emerging as formal commitments focused on measuring and improving not the technical performance of services, but the quality of the experience for the people using them. XLAs do not replace SLAs — they complement them. SLAs define the minimum acceptable level of service, while XLAs define the experience organizations aspire to deliver. Together, they provide a complete view.
You might also be interested in:
Service Level Agreement (SLA) – The key to smooth service delivery

Here are some of the main XLA metrics every service desk should consider in order to move beyond technical numbers and measure what users actually perceive:
Immediate Satisfaction – A simple score from 1 to 5 collected when the ticket is closed — not an email survey sent two days later, when the emotional impact has already faded. The rule is simple: the easier it is to respond, the more data you collect, and the more representative the data becomes. A micro-feedback system integrated into the portal or support chat can reveal, within just a few weeks, significant gaps between what the SLA reports and what users actually experience.
Perceived Effort – How many times did the user have to follow up, call again, or reopen the ticket before receiving a solution? A problem resolved quickly but requiring high effort still leaves a negative impression. Measuring the effort score helps identify processes that work on paper but generate frustration in practice — situations where the SLA is technically met, but the experience remains poor.
Time to Productivity Recovery – Not how long the ticket remained open, but how long the employee remained unproductive. An incident resolved within two hours according to the SLA may still have caused six hours of lost productivity if the employee was unable to work during that time. This is one of the most powerful metrics for aligning IT with business priorities because it translates technical data into measurable business impact.
Reopen Rate – If a user contacts the service desk again for the same issue within 72 hours, the resolution was not truly effective. This is one of the most honest indicators of service quality: the SLA may appear compliant on paper, but the user’s actual need was not fully resolved. Monitoring this metric quickly exposes the illusion of the “green watermelon.”
Sentiment Analysis – Artificial intelligence can analyze the tone and language of support conversations to detect frustration, confusion, or satisfaction in real time — without asking anything directly to the user. Combined with explicit feedback metrics, sentiment analysis provides a more complete picture of the user experience, capturing even what people do not express in formal surveys.
Moving from SLAs to XLAs does not require a revolution. Start by choosing a service you suspect suffers from the Watermelon Effect, add a simple satisfaction question at ticket closure, and compare the results with operational metrics for one month. That comparison will reveal the gap between what the dashboard says and what users actually experience — and it will become the starting point for building a service desk that does not simply close tickets, but genuinely supports people.
With Deepser, SLAs and user experience can coexist within the same workflows. Our Service Level Agreement module allows organizations to monitor response times, priorities, and service levels in a precise and centralized way. Thanks to integrated AI and automation, Deepser helps companies go beyond simply meeting SLAs and build a more efficient, people-oriented service management strategy. Try the free demo and discover how we can support your business.
Parla con noi >