
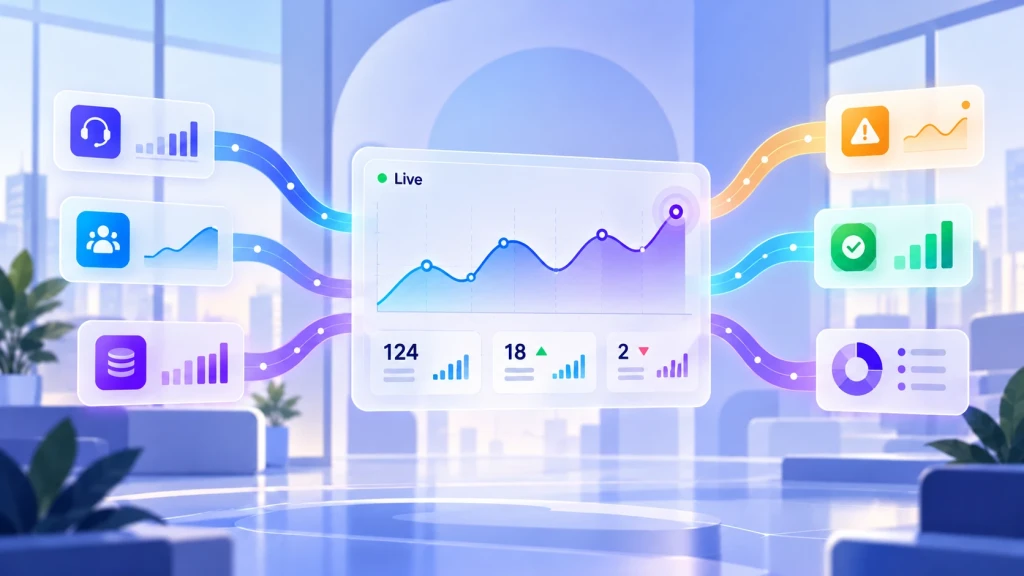
The growing availability of data is transforming the way companies monitor their activities and make decisions. Information changes continuously, and relying solely on weekly or monthly reports can slow down the detection of problems and compromise responsiveness. To avoid these delays, Real-Time Analytics makes it possible to monitor performance through always up-to-date data, promptly spotting the situations that require attention and allowing managers to act before problems get worse.
This need is particularly clear in Service Management, where even a small delay can affect the quality of services. If this information emerges only during the monthly review, acting may already be more difficult. Monitoring indicators in real time, instead, makes it possible to spot the first signs of trouble and act before the consequences become more serious.
You might also be interested in:
The new Deepser Business Intelligence module is here

The limit of periodic reports in business management
Traditional reports remain important tools for assessing results, comparing different periods and planning future activities. The problem arises when they become the only reference for understanding the company’s operational performance. A monthly report, for example, captures a situation that may already have changed by the time it is analyzed. Meanwhile, some priorities have shifted and certain problems may have gotten worse.
In Service Management, this delay can have direct consequences on the quality of services. Think of a support team that records a sudden increase in requests. If the manager notices only at the end of the month, they may already have accumulated a backlog that is hard to manage, with repercussions on response times and user satisfaction. The greatest cost often comes from the time elapsed between the moment a problem appears and the moment it is recognized.
Real-Time Analytics, a trend that is changing how data is used
The need to access information quickly is also transforming the technologies companies use to analyze their performance. According to Gartner, in the Top Trends in Data & Analytics for 2026 report, the growing demand for real-time answers will accelerate the adoption of data streaming technologies for agentic artificial intelligence. In particular, Gartner predicts that the adoption of data streaming for agentic AI will exceed 60% by 2028, compared with less than 15% in 2025. This evolution shows how important the timely availability of information is becoming for organizations.
The concept of Real-Time Analytics fits into this transformation and consists of analyzing continuously updated data, or with sufficiently low latency, to understand what is happening and act when necessary. For an IT manager, this means checking the progress of requests without waiting for a new report to be prepared. For a Service Manager, it means promptly spotting an increase in open tickets or a possible deterioration of service levels. The immediate availability of information thus becomes a key element in improving a company’s responsiveness.
Which indicators to monitor in real time in Service Management
Having access to up-to-date data is particularly useful when the information helps recognize situations that require attention. In Service Management, one of the most important indicators concerns compliance with SLAs, which makes it possible to verify whether requests are handled within the agreed times. Equally significant is the ticket backlog, whose trend helps recognize any accumulation of requests and slowdowns in support processes. Monitoring this data during daily activities lets managers identify issues more quickly and act on priorities.
Another element to consider is the distribution of the workload among operators. When some people handle an excessive number of requests, processing times risk increasing and service quality can suffer. Visualizing the workload of the different teams makes it easier to spot imbalances and better organize assignments. The advantage emerges above all when these indicators are analyzed together, because an increase in the backlog accompanied by a worsening of SLAs can signal a situation that requires immediate action.
From data to decisions with Business Intelligence
Having up-to-date information is the first step, but its value emerges when it becomes easy to interpret and use in daily activities. This is where Business Intelligence comes in, through dashboards that collect the most important indicators and turn them into visual representations. Charts and KPIs allow managers to quickly understand how services are performing, compare results and recognize any anomalies, without having to constantly consult documents or manually gather information from different sources.
For example, a Service Manager who checks a dashboard daily may notice that a certain team is accumulating requests faster than it can resolve them. This information makes it possible to consider a redistribution of activities before the problem further compromises service times. The same principle applies to commercial activities, where monitoring the pipeline and opportunities helps recognize slowdowns and track progress toward targets. The goal is to shorten the distance between the availability of information and the moment decisions are made.
With Deepser‘s Business Intelligence, information becomes accessible through intuitive dashboards that make it easier to monitor services and spot issues. Managers thus get a clearer view of performance and act promptly on the activities that need attention, without having to wait for the next report to find out what is happening. Discover how we can improve control over business performance. Request a free demo now.